January 15, 2026
Kiko Network
1.Introduction
Japan’s Emissions Trading System (GX-ETS) under the umbrella of the Green Transformation (GX) has been portrayed as a core policy for the nation to reduce greenhouse gas emissions by 2030. (GX is an initiative led by the Japanese government to support a shift in industrial structure from fossil-centered to clean energy.) However, as discussions about system design progressed, concerns were raised from various quarters about its effectiveness and transparency. Kiko Network wrote three sets of recommendations in 2025 (in August,[1] November,[2] and December [3]) and posted them (in Japanese) on our website, pointing out fundamental concerns, including the absence of an emissions cap, the lack of transparency in the process of setting reduction rates for emissions intensity, and the framework that ensures a continued reliance on coal power.
Our recommendations were intended to articulate crucial improvements needed before the system’s policy directions were finalized. However, upon reviewing a report and related materials by the Emissions Trading System Subcommittee, Innovation and Environment Subcommittee, under METI’s the Council on Industrial Structure (hereinafter “the Subcommittee”), released on December 19, 2025, it became clear that significant issues remained in the process of setting reduction rates and the basic design of the system.
Regarding the setting of emissions allowances, the Subcommittee recommended that allowances be determined primarily based on sector-specific benchmarks (Subcommittee Report, p. 35, “GX2040 Vision (1) Basic Concepts”). A Benchmark Review Working Group was thus established under the subcommittee. Under the benchmark approach, emissions intensities for each sector are to be set as the benchmark for the relevant year, and allowances are allocated by multiplying this by a baseline activity level. However, instead of using emissions intensity, the Subcommittee recommended the use of “reduction rates” as the standard (setting the maximum at 8.5%). This decision-making process lacked an adequate presentation of the necessary supporting information, effectively rendering the basic policy meaningless. This situation calls for a critical examination of the validity of the process and its conclusions.
Accordingly, building on the concerns raised in our previous recommendations, in this paper we estimate emissions reductions in 2030 under the GX-ETS allocation framework that was intended to achieve booth industrial competitiveness and emissions reductions (hereinafter “the framework”) as presented by the Subcommittee. For this, we use FY2023 data from Japan’s Mandatory Greenhouse Gas Accounting and Reporting System and national Comprehensive Energy Statistics. We also examine whether the framework is consistent with Japan’s Nationally Determined Contribution (NDC) and whether it can result in the level of emission reductions required to achieve the 1.5°C goal.
Below, we first examine problems with the process by which “reduction rates” for 2030 were capped at 8.5% for all benchmark-covered emitters. (Note that here and below, “reduction rates” refers to the percentage of sector-specific reductions in units of emissions intensity, or emissions per unit of activity in that sector.) We then estimate sector-specific reduction rates based on the emissions intensities corresponding to the 32.5% cumulative activity level as presented at the 6th Subcommittee Meeting. Next, since a uniform cap of 8.5% was set on reduction rates for benchmark-covered sectors, we analyze the reduction rates under this cap and then estimate emissions in 2030 based on the reduction rates set out in the Subcommittee Report (Table 3). Finally, we discuss the framework’s structural issues as revealed by our analyses and the directions needed for reforms going forward.
2.Fundamental problems with the framework
Kiko Network has closely followed the deliberation process with the awareness that among carbon pricing measures—a key pillar of international climate policy—the design of the GX-ETS targeting large emitters will determine the course of Japan’s emission reductions. Following the publication of two Subcommittee Reports on December 19, 2025 (“Subcommittee Report on Guidelines for the Implementation of Allowance Allocation for Decarbonized Growth-Oriented Investment Operators” and “Subcommittee Report on the Reference Upper Trading Price and the Adjustment Benchmark Trading Price for FY2026”), we published an analysis on December 30 identifying fundamental issues with the system.
We have repeatedly emphasized a fundamental flaw: the framework does not establish an absolute cap on total emissions, even though such a cap is a fundamental feature of international emissions trading systems. In the absence of an absolute cap, total emissions cannot be controlled, and there is no guarantee that emissions reductions will be achieved. In this respect, the framework differs fundamentally from internationally-recognized emissions trading systems and will suffer from significant limitations in its effectiveness as a mechanism for emissions reductions.
Another issue arises in the allocation of allowances for the period 2026–2030 as set out in the Subcommittee Report. Instead of determining allocations through emissions intensity benchmarks, reduction rates are uniformly capped at 8.5% for benchmark-covered sectors and grandfathered sectors. However, when this unambitious reduction rate was determined—that is, when the decision was made to limit the extent of emissions reductions—there was no explicit disclosure of the sector-specific reduction rates based on emissions intensity levels corresponding to the top 32.5% of cumulative activity, nor emissions projections for 2030. Therefore, the cap on reduction rates was obviously determined without an adequate evaluation and consideration of its implications for the framework. This is a significant issue that undermines the very legitimacy of the framework.
Accordingly, using the latest FY2023 data from the Mandatory Greenhouse Gas Accounting and Reporting System, Kiko Network estimated sector-specific and total emissions in FY2030 under two scenarios. Scenario 1 reflects publicly-announced plant closures. Scenario 2 assumes that FY2023 activity levels are maintained even in 2030. Our analysis of GX-ETS as it is currently planned found that in FY2030, emissions would be only negligibly lower in major high-emitting sectors among benchmark-covered industries: basic materials sector (energy-intensive industries such as steel, cement, chemicals, pulp and paper manufacturing), petroleum refining, and power generation. Together, those sectors accounted for about 60% of Japan’s total emissions in FY2023 (while this framework also covers about 60% of national emissions).
Our analysis revealed outcomes that stem from a highly opaque and illogical process in which an unambitious reduction rate of 8.5% (1.7% × 5 years) was set for grandfathering, without having first presented crucial information to underpin the deliberation process on emission allocation methods. On top of that, in the absence of meaningful discussion, that rate was also adopted as an upper limit for benchmark-covered sectors.
As noted above, the framework suffers from a fundamental design that not only fails to set a cap but also sets the grandparenting reduction rate (8.5% over five years) as the target. Thus, it does not deserve to be described as a mechanism to promote reductions in major emitting sectors.
3.Issues with the process of setting reduction rates for covered emitters
As noted above, the process of setting reduction rates for covered emitters under benchmarks and grandfathering—as described in the Subcommittee Report—suffered from ambiguity and a lack of transparency, and it is a major concern that discussions failed to include concrete sector-specific reduction rates. Here, we look at how the upper limit of the benchmark reduction rate was set at 8.5% during the policy formulation process.
(1) The process leading to the 8.5% reduction rate
The reduction rates applied to each sector subject to sector-specific benchmarks and grandfathering are among of the most important factors that will determine the effectiveness of the framework.
(a) Setting the upper limit for cumulative activity at 32.5% (5th Subcommittee Meeting, Doc. 3, p. 28)
In principle, the benchmark standards under the Act on the Rational Use of Energy (also referred to as the Energy Conservation Act) are established based on the emissions intensity of the top 15% of emitters as measured by cumulative activity volume. However, due to the substantial gap in some industries compared to the top 50% average, the Subcommittee opted for an interim benchmark using the “top 32.5% of cumulative activity volume” through 2030 (Figure 1). At the 6th Subcommittee Meeting it became clear that the biggest gap is in the power generation sector.
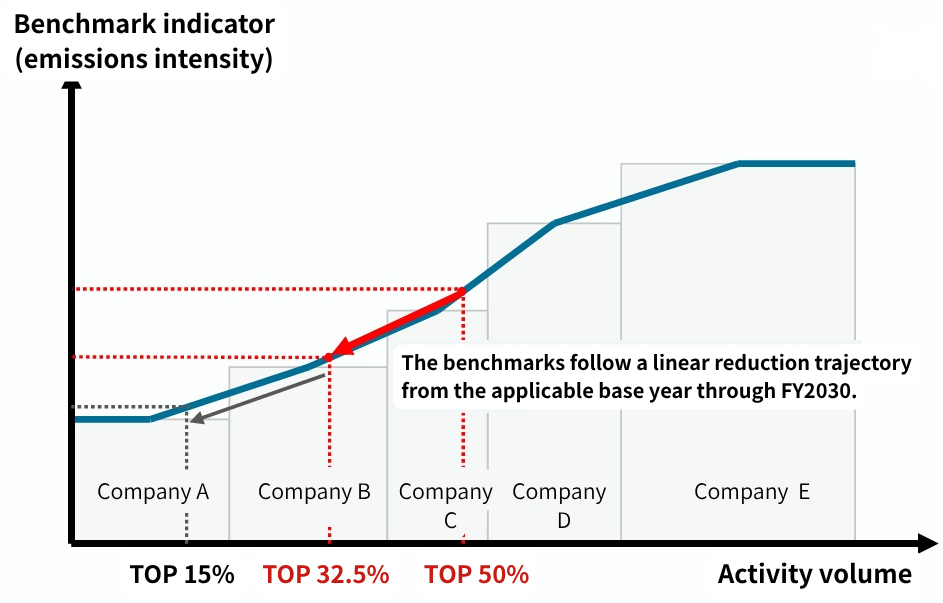
Description: If the standard emission intensity in the base year is set at the top 50% level, it is considered appropriate to set the benchmark level for FY2030—five years later—at the top 32.5% level, which is midway between the top 15% and 50% levels. However, companies whose figures fall below the benchmark will not be required to make reduction efforts, while measures will be taken to ensure that reductions do not become an excessive “burden” for companies whose figures significantly exceed the benchmark.
Source: Prepared by Kiko Network from Subcommittee Report Dec. 19, 2025.
As a result of this change, sector-specific reduction rates were substantially relaxed compared to emissions intensities at the top 15% level of cumulative activity volume, although the sector-specific reduction rates adopted at the top 32.5% level had still not been published at the time of the present report.
(b) Reduction rate of 1.7% annually used as upper limit under the grandfathering method (4th Subcommittee Meeting, Doc. 3, p. 34)
A further problem is that the reduction rate for benchmark-covered sectors was set using a reduction rate as the upper limit under the grandfathering method (8.5% over five years).
The Subcommittee’s secretariat set a reduction rate of 1.7% per year, or 8.5% over five years, for grandfathering-covered sectors, based on the assumption that fuel switching from oil to gas would take 10 years (Interim Report, p. 72). [4]In Kiko Network Recommendations Report 3 (available only in Japanese), we pointed out the impropriety of this process.
The benchmark approach was intended to be a mechanism that sets higher reduction rates based on differences in emissions intensity across sectors. However, citing “fairness,” the Subcommittee decided to apply this low reduction rate for grandfathering directly to benchmark-covered sectors as well.
As a result, even in sectors where reductions exceeding 8.5% would be required based on emissions intensity at the top 32.5% cumulative activity level, reduction rates were suppressed at 8.5% (6th Subcommittee Meeting, Doc. 3, p. 76).
(c) Ceiling adopted without disclosure of sector-specific reduction rates
Despite the upper value on the reduction rate being set at 8.5%, basic information such as the following was not presented during the Subcommittee’s deliberations:
- What reduction rate will be applied in each sector?
- How much emissions should be reduced when using the top 32.5% cumulative activity level (emissions intensity) as the standard?
- What levels of emissions reductions are expected by 2030?
Although Doc. 4 of the 6th Subcommittee Meeting presented emissions intensity by sector (at the top 15%, 32.5%, and 50% cumulative activity level), the sector-specific reduction rates derived from them were not provided. It is serious concern that reduction rates, which form the core of the system, were determined without any concrete justification or impact analysis.
(d) Result is that reduction rates in major emitting sectors are kept exceedingly low
As a result of this process of determining rates, the levels fell significantly short of the required reduction rates in these major emitting sectors:
- Basic materials sector (steel, chemicals, cement, pulp and paper manufacturing)[5]
- Petroleum refining
- Power generation[6]
In power generation in particular, the use of fuel-specific benchmarks has resulted in setting an extremely small reduction rate for coal power, thus entrenching a system that ensures the continued use of coal.
(2) Sector-specific reduction rates: Kiko Network’s analysis and findings
Tables 1 and 2 summarize emissions intensities (referred to as “CO2 emissions intensity” in advisory council documents), excerpted from Subcommittee Doc. 4. Our analysis reveals the following ripple effects of capping the emissions intensity reduction rates at 8.5% (reducing 1.7% annually for five years).
(a) Significant weakening of reduction rates compared to the original benchmark (top 15% cumulative activity level)
As shown in Table 1, to achieve the emission intensity level of the top performers at the top 15% cumulative activity level, which is prescribed as the original benchmark standard under the Energy Conservation Act, many industries would need to achieve a 20-50% reduction.
Notably, the original reduction rates under the Act were very high in the following sectors:
- Pulp and paper (paper): −46.9%
- Caustic soda (chlor-alkali): −55.0%
- Road freight transport: −50.4%
- Lime (energy-related): −45.8%
These reduction rates were aligned with the idea of having emitters approach the emissions intensity levels of the most efficient emitters, exactly as envisaged by international benchmark systems.
However, the GX-ETS goes significantly lower than the reduction rates originally required, by basing the framework on the emissions intensity performance of the top 32.5% in terms of cumulative activity, and then further capping the required reductions at a reduction rate of 8.5%.
(b) Capping reduction rates at 8.5% significantly relaxes requirements for major emitting industries
Even sectors that need to make significant reductions have their reduction rates uniformly capped at the upper limit of 8.5%.
Here are some examples to illustrate the difference between the emissions intensity reduction rate for each industry in 2030 if the top 15% benchmark is achieved, versus the reduction rate under GX-ETS:
- Pulp and paper (paper): −46.9%, revised to −8.5% under GX-ETS
- Caustic soda: −55.0%, revised to −8.5% under GX-ETS
- Lime (energy-related): −45.8%, revised to −8.5% under GX-ETS
- Blast furnace steel (downstream processes) : −24.7%, revised to −8.5% under GX-ETS
Notably, the energy-intensive basic materials sector (steel, chemicals, ceramics, and paper manufacturing) accounts for the majority of emissions in Japan’s industrial sector, so the significant relaxation in their reduction rates significantly limits the overall emissions reduction effectiveness of the system.
(c) Implications of the failure to present sector-specific reduction rates
The Subcommittee presented the emissions intensities for the top 15%, 32.5%, and 50% of cumulative activity levels, but did not present the most important information to evaluate the effectiveness of the system on the following:
- the resulting sector-specific reduction rates
- sector-specific emissions after implementing measures based on GX-ETS
- expected overall emission reductions under GX-ETS
As mentioned, the upper limit on reduction rates was decided without crucial basic information.
Table 1 and Table 2 describe the calculation method for the 2030 emissions intensity targets (reduction rate per unit of activity) as calculated by Kiko Network, based on sector-specific CO2 emissions intensity as published in Doc. 4 of the Sixth Subcommittee Meeting.
Table 1. FY2030 emissions intensity reduction benchmarks for non-power sectors (Industry and Transport)
| FY2030 intensity targets (% reduction per activity unit) | CO2 intensity by sector (normalized) *1 | |||||
| A. Reduction at top 15% level | B. GX-ETS estimated reduction (32.5%) with 8.5% maximum reduction rate | C. GX-ETS estimated reduction (32.5%) without maximum reduction rate | Top 15% (cumulative) | Top 32.5% (cumulative) | Top 50% (cumulative) | |
| Pulp and paper (paper) | -46.9% | -8.5% | -43.8% | 0.49 | 0.519 | 0.923 |
| Pulp and paper (paperboard) | -30.3% | -3.7% | -3.7% | 0.319 | 0.441 | 0.458 |
| Caustic soda | -55.0% | -8.5% | -50.3% | 0.85 | 0.94 | 1.89 |
| Carbon black | -18.0% | -6.2% | -6.2% | 1.46 | 1.67 | 1.78 |
| Basic petrochemicals | -14.3% | -6.1% | -6.1% | 0.42 | 0.46 | 0.49 |
| Organic chemicals | -11.9% | -6.4% | -6.4% | 5.4 | 5.74 | 6.13 |
| Oil refining | -12.7% | -8.5% | -9.1% | 0.0048 | 0.005 | 0.0055 |
| Rubber products | -7.2% | -1.6% | -1.6% | 4.64 | 4.92 | 5 |
| Flat glass manufacturing | -13.2% | -8.5% | -9.9% | 0.5 | 0.519 | 0.576 |
| Glass bottle manufacturing | -10.5% | -5.6% | -5.6% | 0.434 | 0.458 | 0.485 |
| Cement | -2.1% | -1.4% | -1.4% | 0.812 | 0.817 | 0.829 |
| Lime (energy-related CO2) | -45.8% | -8.5% | -12.0% | 0.122 | 0.198 | 0.225 |
| Lime (quicklime manufacturing processes) | -3.2% | -0.8% | -0.8% | 0.718 | 0.736 | 0.742 |
| Lime (dolomite manufacturing processes) | -7.8% | -2.5% | -2.5% | 0.776 | 0.821 | 0.842 |
| Blast furnace steelmaking (upstream) *2 | -1.9% | -0.9% | -0.9% | 2.07 | 2.09 | 2.11 |
| Blast furnace steelmaking (downstream) *2 | -24.7% | -8.5% | -12.3% | 0.055 | 0.064 | 0.073 |
| Blast furnace – regular steel (upstream) *2 | -24.1% | -4.5% | -4.5% | 0.202 | 0.254 | 0.266 |
| EAF – regular steel (downstream) *2 *3 | -6.1% | -2.0% | -2.0% | 0.046 | 0.048 | 0.049 |
| EAF – specialty steel (upstream) *2 *3 | -12.4% | -5.4% | -5.4% | 0.227 | 0.245 | 0.259 |
| EAF – specialty steel (downstream) *2 *3 | -3.2% | -1.3% | -1.3% | 0.0507 | 0.0517 | 0.0524 |
| Aluminum (upstream) | -15.7% | -8.5% | -8.5% | 0.199 | 0.216 | 0.236 |
| Aluminum (downstream) | -11.6% | -2.4% | -2.4% | 0.22 | 0.243 | 0.249 |
| Automotive | -7.6% | -6.7% | -6.7% | 0.097 | 0.098 | 0.105 |
| Road freight transport | -50.4% | -8.5% | -32.3% | 0.666 | 0.908 | 1.342 |
| Coastal shipping | -4.6% | -2.2% | -2.2% | 26.32 | 26.98 | 27.59 |
| Air transport | -4.4% | -1.6% | -1.6% | 1.101 | 1.133 | 1.152 |
*1. From 6th Meeting of the Emissions Trading System Subcommittee, Doc. 4
*2. The steel industry is divided into upstream and downstream processes for both blast furnaces and electric arc furnaces. A larger share of emissions comes from upstream processes. In the case of blast furnaces, if upstream processes account for 90% of emissions, the reduction rate will only be 0.9% × 90% + 8.5% × 10% = 1.66%.
*3. EAF = Electric arc furnace
Source: Calculated/prepared based on 6th meeting of the Industrial Structure Council Innovation and Environment Committee, Emissions Trading System Subcommittee, Doc. 4. Benchmark Indicators by Industry Type (Draft) (Secretariat Reference Document) (in Japanese)
Supplementary explanations (for Table columns)
A. Reductions at top 15% level (cumulative activity volume): These are the emissions reductions that result if adopting the reduction target levels under the Energy Conservation Act (top 15% cumulative activity level).
B. Emissions reductions under GX-ETS top 32.5% level with the 8.5% reduction cap: Here we indicate the lesser of (a) the reduction rate required to achieve the CO₂ emissions intensity of emitters at the top 32.5% cumulative activity level (the midpoint between the top 15% and 50%) and (b) an 8.5% reduction. This column shows the reduction rates for benchmark-covered sectors when applying the reduction rates recommended by the Subcommittee, which set the reduction rate for grandfathering-covered sectors low at 8.5% and, citing fairness, downwardly revised the reduction rates for benchmark-covered sectors by setting this as their upper limit (cap) as well.
C. This column shows the estimated reductions under GX-ETS top 32.5% level without reduction cap: Specifically, the numbers shown indicate the reduction rate required to achieve the sector-specific CO₂ emission intensity of emitters corresponding to the 32.5% initially set by the Subcommittee, being the midpoint between the top 15% and 50% cumulative activity levels. The “Sector-specific CO2 emissions intensity” listed in Table 1is noted as the “CO2 emission intensity of entities under high-level standard entity” in Subcommittee documents.
(d) In the power generation sector, the framework effectively sets extremely low emissions intensity reduction rates for coal
Estimated power sector reduction rates are based on two scenarios. Scenario 1 accounts for projected plant closures and decommissions from FY2023 onward. Scenario 2 assumes no such closures and no transitions to electric arc furnaces (EAF). In the former, calculations were made based on publicly-announced plant closure plans, setting emissions from those facilities at zero (or halved), while in the latter case it was assumed that 2023 activity levels would be maintained through 2030.
Fuel-specific benchmarks were adopted in the power sector. As a result, the reduction rate for coal-fired power is extremely small (the fuel-specific reduction rate is −1%). For LNG-fired power generation, the fuel-specific reduction rate is −0.3%.
In the power sector, a method is also adopted under which “all-thermal average” benchmarks are introduced for 20% (2029) and 40% (2030) of allowances, yet even then the emissions factors for coal-, oil-, and LNG-fired power generation far exceed the target values in the Sixth Strategic Energy Plan (0.25 kg-CO₂/kWh).
In other words, the adoption of fuel-specific benchmarks creates a system that allows for the continued operation of coal-fired power plants.[8]
Table 2. FY2030 emissions intensity reduction benchmarks (Power sector)
| FY2030 intensity targets | CO2 intensity by fuel/category (normalized) | |||||||||
| Reduction at top 15% level | GX-ETS estimated reduction (32.5%) with 8.5% maximum reduction rate | GX-ETS estimated reduction (32.5%) without maximum reduction rate | GX-ETS reduction rate by fuel type | Top 15% (cumulative) | Top 32.5% (cumulative) | Top 50% (cumulative) | All-thermal average | Power sector weighted average in 2030 (incl. all-thermal) | Target 2030 emission factors for all electricity sources (6th Strategic Energy Plan) | |
| Power generation Coal | -53.7% (-69%) | -11.2% | -11.2% | -1.0% | 0.783 | 0.8032 | 0.8114 | 0.596 | 0.721 | 0.25 |
| Power generation LNG | -2.7% (-35%) | +21.7% | +21.7% | -0.3% | 0.3755 | 0.3849 | 0.3859 | 0.596 | 0.470 | |
| Power generation Oil | -52.3% (-68%) | -12.9% | -12.9% | -5.3% | 0.5609 | 0.7452 | 0.7871 | 0.596 | 0.686 | |
Note: For the power generation sector, the reduction figures shown for achieving the “top 15% level” reflect the reductions required to reach the top 15% efficiency level for natural gas. Figures in parentheses indicate the reduction rates when targeting the CO₂ emissions intensity for FY2030 as outlined in the Sixth Strategic Energy Plan.
(3) Summary of issues in the determination of reduction rates
Under the Emissions Trading System Subcommittee, discussions on sector-specific benchmarks have been conducted through two dedicated working groups: manufacturing and power generation. However, presumably in response to industry requests, the target emissions intensity levels were significantly weakened from the original “top 15% level.” Furthermore, an upper limit was placed on the maximum reduction rate of emissions intensity for each sector. As a result, the required reduction rates have dropped sharply, with targets set particularly low for emitters with a high proportion of coal fuel in their energy mix. By drastically lowering the reduction requirements for power generators, the system essentially allows for the preservation of coal-fired power plants. While the framework may maintain the appearance of a robust policy design, it ultimately serves to delay the necessary transformation of Japan’s industrial structure.
4.Kiko Network’s estimates of emission reductions in FY2030
In the deliberations on the design of the framework, which went through seven Subcommittee Meetings, no estimates of emissions reductions for FY2030 were presented. Accordingly, Kiko Network estimated emissions reductions for Scenario 1 and Scenario 2 based on the sector-specific reduction rates calculated in Table 2. Table 3 summarizes these results.
Table 3. CO2 emission reduction rates for FY2030 under the GX-ETS
| 2023 CO2 emissions (Mt CO2) | Emissions estimates for FY2030 under GX-ETS | ||||||||
| Scenario 1. Plant closures from 2023 onward | Scenario 2. No plant closures or EAF transitions | ||||||||
| CO2 emissions (Mt CO2) | vs 2013 | vs 2019 | vs 2023 | CO2 emissions (Mt CO2) | vs 2013 | vs 2019 | vs 2023 | ||
| Primary materials, oil refining | 264 | 221 | -37% | -36% | -16% | 254 | -28% | -26% | -4% |
| Thermal power generation | 364 | 363 | -25% | -8% | 0% | 363 | -25% | -8% | 0% |
| Total of above | 629 | 584 | -30% | -21% | -11% | 618 | -26% | -17% | -2% |
| Japan’s national CO2 reduction target (NDC / Plan for Global Warming Countermeasures)[9] | 989 | 745 | -43% | -32% | -25% | 745 | -43% | -32% | -25% |
Assumptions used in estimating 2030 emission reductions
Base year emissions for covered manufacturing entities: Under the framework, base-year emissions are defined as the average emissions from FY2023, FY2024, and FY2025. However, as only FY2023 data are currently available via the Mandatory Greenhouse Gas Accounting and Reporting System, this report calculates emissions by applying GX-ETS sector-specific benchmark reduction rates to the CO₂ emissions of entities whose direct emissions were estimated at 100,000 tonnes or more in FY2023[10]. However, for plants with publicly announced closure plans, emissions from those facilities from 2023 onward were set to zero in the calculations (or halved if partial shutdowns were planned). No additional emission allowances have been added based on considerations other than sector-specific benchmarks.
Emissions from thermal power plants: Assuming activity levels remain constant at FY2023 levels, emissions were calculated by applying the GX-ETS fuel-specific benchmark reduction rates to the FY2023 emissions data for utility-scale power generation from the Comprehensive Energy Statistics (METI). For FY2029 and FY2030, the reduction rates were derived by combining the respective 20% and 40% targets with the industry-wide average for all thermal power generation.
(1) Minimal emissions reductions in the basic materials manufacturing, petroleum refining, and thermal power generation sectors
The estimation results show that when applying GX-ETS benchmark (emissions intensity) reduction rates, emissions in FY2030 under Scenario 2, assuming no plant closures or transitions to electric arc furnaces, are:
- Basic materials sector (energy-intensive industries) and petroleum refining: −28% vs. 2013, −26% vs. 2019, −4% vs. 2023
- Thermal power generation: −25% vs. 2013, −8% vs. 2019, ±0% vs. 2023
- Total: −26% vs. 2013, −17% vs. 2019, −2% vs. 2023
Even under Scenario 1, assuming plant closures after FY2023, the results for emissions are only as follows:
- Basic materials sector (energy-intensive industries) and petroleum refining: −37% vs. 2013, −36% vs. 2019, −16% vs. 2023
- Thermal power generation: −25% vs. 2013, −8% vs. 2019, ±0% vs. 2023
- Total: −30% vs. 2013, −21% vs. 2019, −11% vs. 2023
Notably in Scenario 2, emissions from all covered sectors decrease by only 2% relative to 2023 by 2030; this underscores the fact that the framework provides negligible incentives for actual emission reductions.
(2) A significant disparity with Japan’s national reduction target (NDC)
Under Japan’s Global Warming Countermeasures Plan, CO₂ emissions are required to be reduced by 43% by 2030 compared to 2013, which corresponds to a 32% reduction compared to 2019 and a 25% reduction compared to 2023.
However, major emitting sectors covered by GX-ETS (basic materials manufacturing, petroleum refining, and thermal power) show reductions of only 26–30% vs. 2013, 17–21% vs. 2019, and 2–11% vs. 2023, representing a large gap from the national reduction target. Given that the sectors covered by the GX-ETS account for roughly 60% of national emissions, a failure to secure reductions in these sectors poses a structural barrier to meeting Japan’s NDC.
(3) Additional allocation (“special consideration items”) could effectively result in zero reductions
Under the framework, additional allocations are planned for “special consideration items” such as production fluctuations, carbon leakage countermeasures, and research and development. According to explanations from the Subcommittee’s secretariat, carbon leakage measures alone are assumed to require additional allowances equal to “2–3% of covered entities’ emissions.”
For Scenario 2 (no closures) in Table 3, the projected reduction by 2030 is only 2% compared to 2023. Such additional allocations risk nullifying actual emission reductions or even causing allowance caps to exceed 2023 levels, resulting in a surplus of allowances similar to the early stages of the EU and South Korean emissions trading systems. Moreover, since emission allowances can be carried over (banking) without restriction, there are risks of a market glut with surplus allowances, which could lead to prolonged price stagnation and undermine the integrity of the system.
5.Conclusion: System needs fundamental revisions
This review underscores the gravity of the flaws within the GX-ETS, which lacks the fundamental requirements of an economic mechanism intended to secure the national NDC and drive the transition to a decarbonized economy. Beyond merely accommodating individual emitters’ requests, the Subcommittee adopted a top 32.5% cumulative activity level—a major deviation from the original 15% benchmark—while further capping the reduction rate at a mere 8.5%. Consequently, emission reductions in major emitting sectors will remain limited, undermining the system’s overall mitigation impact. Of particular concern is that the current framework effectively permits the continued reliance on coal-fired power. Such a system design will make it difficult for Japan to realize a reduction pathway consistent with 2030 emission reduction levels required by its NDC. To effectively drive mitigation investment and accelerate the transition to a decarbonized economy, the GX-ETS requires a fundamental overhaul. Essential revisions include establishing an overall emissions cap, tightening benchmarks, increasing transparency, limiting additional allocations, and strengthening market oversight and banking regulations.
“On July 23, 2025, the International Court of Justice (ICJ) ruled that NDCs must reflect each country’s highest possible ambition toward the 1.5°C goal. This determination is based on the principle of “Common But Differentiated Responsibilities and Respective Capabilities” (CBDR-RC), as referenced in Article 3.1 of the UNFCCC. Moreover, it clearly stated that it is a national legal obligation to implement measures to achieve the targets (including regulating fossil fuel use by private enterprises), and carry out their implementation and verification.
The global emission reduction levels required to achieve the 1.5°C goal are outlined in the IPCC Sixth Assessment Report Synthesis Report (IPCC AR6 SYR) and recognized in the COP26 decisions. In its NDCs for 2035 and 2040 submitted to the UNFCCC Secretariat in 2025, the government explained that these targets are consistent with the 1.5°C goal. Nevertheless, in view of the ICJ’s standards, the NDC of Japan, a G7 nation, is insufficient. Moreover, this framework fails to serve as the core mechanism it was meant to be, as it lacks the effectiveness required to drive the transition, rendering it unfit for its purpose.
Furthermore, the ruling suggests that failing to protect the climate system could amount to an internationally wrongful act. This raises the distinct possibility that Japan could face international legal challenges for non-compliance with its global obligations.
Accordingly, the proposed GX-ETS framework requires an immediate overhaul to align with international emissions trading standards. This process hinges on the transparent and timely disclosure of data essential to evaluate the framework.
This urgency is echoed in the supplementary resolution to the amended GX Promotion Act, which mandates verifying and publishing the system’s alignment with the 1.5°C goal and the NDC. For the GX-ETS to become a true engine of Japan’s energy transition, the framework must be subject to ongoing review and revision based on global best practices. It is our hope that this paper provides the necessary catalyst for these vital discussions at home and abroad.
Footnotes
- Kiko Network Recommendations Report 1 on the Design of Japan’s Emissions Trading System (in Japanese) https://kikonet.org/content/38253
- Kiko Network Recommendation Report 2 on the Design of Japan’s Emissions Trading System (in Japanese) https://kikonet.org/content/38568
- Kiko Network Recommendations Report 3 on the Design of Japan’s Emissions Trading System (in Japanese) https://kikonet.org/content/38868
- This assumes full fuel switching to city gas over a 10-year period, based on the current fuel mix of the covered sectors (60% petroleum-based, 40% natural or city gas), which would result in a total CO₂ reduction of 17% (1.7% annually). For the initial five-year period of the system (2026–2030), the reduction is set at 8.5% (i.e., 1.7% x 5 years).
- However, while this includes downstream processes for blast furnace steelmaking, the sum for both upstream and downstream processes is under 8.5%.
- In the power generation sector, for all fuels (average for all thermal) this significantly exceeds 8.5%, although it is less than 8.5% for each fuel type.
- The steelmaking industry using blast furnaces has benchmarks set for both upstream processes (mainly the blast furnace stage where much of the CO2 is emitted) and downstream processes (such as processing and in-house power generation). For upstream processes, entities originally at the 1.9% reduction rate (being in the top 15% in cumulative activity level) ended up only needing to achieve the 0.9% reduction rate that applies to the top 32.5%.
- Under this framework, “closely related partied” with capital ties are permitted to collaborate on emissions reductions. Using this provision, for instance, a power generator operating solely on coal-fired plants and another with a large share of natural gas-fired capacity could jointly apply for emissions allowances. This could allow the coal-only operator to offset its individual reduction requirements using the increased allowance allocation of the gas-heavy operator (see “Power Generation, LNG” in Table 2), potentially resulting in the preservation of coal-fired assets.
- Note. The national CO2 reduction rate is set at 43% under the Plan for Global Warming Countermeasures, comprising a 45% reduction in energy-related CO2 and a 15% reduction in non-energy CO2.
- Direct emissions were estimated by multiplying energy-related CO₂ emissions from indirect sources by the sector-specific “direct ratio” (calculated as Direct / (Direct + Indirect)) derived from the Comprehensive Energy Statistics.
File Download from here
A Critical Assessment of Japan’s Emissions Trading System (GX-ETS) (PDF)
Contact
Kiko Network
(Kyoto Office) 305 Takakura Bldg. Takakura-dori, Shijo-agaru, Nakagyo-ku, Kyoto 604-8124, JAPAN(→Access)
(Tokyo Office) 6B, Fujimori Bldg., 2-12-2, Hirakawacho, Chiyoda-ku, Tokyo 102-0093, JAPAN(→Access)
+81-75-254-1011 +81-75-254-1012(Kyoto Office) https://kikonet.org